Understanding the types of data you’re working with is essential. Two of the most fundamental data types are qualitative and quantitative data. While they may sometimes appear to overlap, they serve very different purposes and are used in various ways.
We’ll explain the key differences between qualitative and quantitative data, using real-world examples to help you understand when and how to use each.
What is Qualitative Data
Qualitative data is non-numerical information that captures qualities, characteristics, and descriptions rather than measurable quantities. It is typically expressed in words, images, or symbols and is used to understand concepts, opinions, or experiences. Unlike quantitative data, which deals with numbers and statistics, qualitative data focuses on the “why” and “how” of a subject. It is commonly collected through interviews, observations, open-ended surveys, or focus groups. For example, feedback like “the staff was constructive” or “the atmosphere felt welcoming” is a form of qualitative data. This data type is especially valuable in fields like social sciences, marketing, and education, where a deep, detailed understanding is essential.
Characteristics of Qualitative Data
-
Descriptive: Captures details like color, texture, behavior, or opinion.
-
Subjective: Often based on personal experiences or interpretation.
-
Non-statistical: Cannot usually be analyzed using standard mathematical techniques.
-
Text-based or visual: Usually presented in words, images, audio, or video.
What is Quantitative Data
Quantitative data refers to information that can be measured, counted, and expressed numerically. It deals with quantities and values, making it ideal for statistical analysis and mathematical calculations. This type of data answers questions like “how much,” “how many,” or “how often,” and is often collected through surveys, experiments, or structured observations. Quantitative data is typically categorized into discrete data (whole numbers, like the number of students in a class) and continuous data (measurable quantities, like height or temperature). It is widely used in economics, science, business, and education to identify patterns, make comparisons, and draw conclusions based on numerical evidence.
Characteristics of Quantitative Data
1. Numerical Nature
Quantitative data consists of numbers that represent measurable quantities, such as age, income, height, or test scores.
2. Measurable and Countable
It answers questions like how much, how many, how often, and how long, making it helpful in making precise comparisons.
3. Statistical Analysis
Quantitative data can be analyzed using statistical methods, such as averages, percentages, correlations, and standard deviations.
4. Objective and Reliable
Since it’s based on measurable facts, the data is less prone to personal bias or interpretation.
5. Structured Format
It is usually collected in a structured way—through surveys with fixed responses, experiments, or databases—making it easy to organize and process.
6. Two Main Types:
-
Discrete Data: Whole numbers (e.g., number of cars, students)
-
Continuous Data: Any value within a range (e.g., weight, temperature)
Differences Between Qualitative and Quantitative Data
Qualitative and quantitative data are two main types used in research and analysis, each with its characteristics and collection methods. Here’s a breakdown of their key differences:
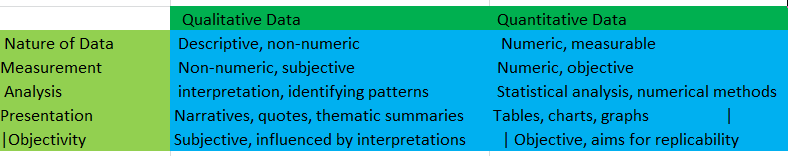
- Nature of Data:
- Qualitative Data: This type of data is descriptive and deals with qualities or characteristics that cannot be measured numerically. It focuses on understanding individuals’ underlying reasons, motivations, opinions, and behaviors. Examples include interviews, open-ended survey responses, observations, and textual analysis.
- Quantitative Data: Quantitative data, on the other hand, deals with quantities and numerical values that can be measured and analyzed statistically. It is structured and often involves counting or measuring attributes. Examples include surveys with closed-ended questions, measurements, counts, and statistical analysis of numerical data.
- Measurement:
- Qualitative Data: Measurements in qualitative data are non-numeric and often subjective. They rely on researchers’ or participants’ interpretations, classifications, and categorizations. This data is typically expressed through words, images, or symbols.
- Quantitative Data: Quantitative data involves numerical measurements and objective observations that can be counted or measured. It provides precise and standardized information for statistical analysis and mathematical computations.
- Analysis:
- Qualitative Data: Qualitative data analysis involves interpreting data to identify patterns, themes, and trends. It requires a deep understanding of context and often involves coding, categorizing, and interpreting textual or visual data.
- Quantitative Data: Quantitative data analysis is focused on statistical techniques such as mean, median, mode, standard deviation, correlation, regression, and hypothesis testing. It aims to quantify relationships, patterns, and trends in data through numerical analysis.
- Presentation:
- Qualitative Data: Qualitative data is often presented through narratives, quotes, case studies, or thematic summaries. Visual representations such as charts or graphs may also illustrate findings.
- Quantitative Data: Quantitative data is typically presented through tables, charts, graphs, or statistical summaries, visually representing numerical information. These visualizations help to communicate trends, comparisons, and relationships in the data.
- Objectivity:
- Qualitative Data: Qualitative data collection and analysis are subjective processes influenced by the perspectives and interpretations of researchers or participants. They allow for a deeper exploration of complex phenomena but may be prone to bias.
- Quantitative Data: Quantitative data collection and analysis aim for objectivity and replicability. It relies on standardized procedures and statistical methods to minimize bias and ensure reliability and validity.
Read on: Difference between Primary and Secondary Sources
|
Qualitative Data |
Quantitative Data |
| Nature |
Descriptive, non-numerical |
Numerical, measurable |
| Form |
Words, images, observations |
Numbers, counts, measurements |
| Purpose |
To explore ideas, understand experiences |
To quantify variables, identify patterns |
| Data Collection Methods |
Interviews, focus groups, and open-ended surveys |
Structured surveys, experiments, and statistical tools |
| Analysis Method |
Thematic, content, or narrative analysis |
Statistical analysis, graphs, and charts |
| Example |
“The room felt cozy and inviting.” |
“The room was 20 square meters in size.” |
| Type |
Subjective, interpretive |
Objective, precise |
| Use Case |
Social sciences, psychology, education |
Economics, engineering, and natural sciences |
Examples of quantitative and qualitative data
Quantitative Data (Numerical, measurable)
Quantitative data deals with numbers and things you can measure objectively.
Examples:
-
A person’s height in centimeters (e.g., 175 cm)
-
The number of students in a classroom (e.g., 30 students)
-
Temperature readings over a week (e.g., 23°C, 25°C, 21°C)
-
Income in dollars (e.g., $50,000/year)
-
Number of website visitors per day (e.g., 1,200 visitors)
Qualitative Data (Descriptive, categorical)
Qualitative data is descriptive and conceptual. It can be categorized based on traits and characteristics.
Examples:
-
Colors of cars in a parking lot (e.g., red, blue, black)
-
Types of cuisine preferred (e.g., Italian, Chinese, Mexican)
-
Customer satisfaction feedback (e.g., “Very satisfied”, “Neutral”, “Dissatisfied”)
-
Hair texture (e.g., curly, straight, wavy)
-
Brand names of shoes people wear (e.g., Nike, Adidas, Puma)
FAQ
What is the main difference between qualitative and quantitative data?
The main difference lies in what they represent:
When should I use qualitative data?
Use qualitative data when you want to explore why people think or behave a certain way. It’s ideal for:
-
Open-ended survey questions
-
Interviews and focus groups
-
Understanding emotions, opinions, and motivations
When is quantitative data more useful?
Quantitative data is useful when you need to:
-
Track measurable performance
-
Analyze trends over time
-
Perform statistical analysis
It answers questions like “How many?”, “How much?”, or “How often?”
Can you convert qualitative data into quantitative data?
Yes, in some cases. For example:
-
Categorizing feedback into themes (e.g., positive/negative) and counting them
-
Assigning scores to responses (e.g., rating satisfaction from 1 to 5)
However, this process involves interpretation and may lose some of the depth of qualitative insights.
Can a study use both types of data?
Absolutely. Many researchers use a mixed-methods approach, combining qualitative and quantitative data to get a fuller picture. For example:
Are charts and graphs only for quantitative data?
Mostly yes, since charts and graphs work best with numbers. However, qualitative data can be visualized through:


 Evan John