ER diagrams play a crucial role in database design and management. They provide a visual representation of the relationships between entities in a database, helping to design efficient, well-structured systems. We will explore the concept of ER diagrams, their importance, and how students can use them effectively in assignments. What is an ER Diagram? An Read More
Chat with our experts to get the best quote. Make the payment via online banking, debit/credit cards or through paypal. Recieve an order confirmation number.
Sit back and relax. Your well written, properly referenced research paper will be mailed to your inbox, before deadline. Download the paper. Revise and Submit.
ER diagrams play a crucial role in database design and management. They provide a visual representation of the relationships between entities in a database, helping to design efficient, well-structured systems. We will explore the concept of ER diagrams, their importance, and how students can use them effectively in assignments.
What is an ER Diagram?
An Entity-Relationship (ER) diagram is a graphical representation of entities, relationships, and attributes in a database. Initially introduced by Peter Chen in 1976, ER diagrams are widely used in conceptual database design Chen, 1976. They allow designers to visualize database structures, making it easier to communicate complex relationships.
Key Components of ER Diagrams
Entities and Relationships
In an ER diagram, entities represent real-world objects, such as customers, products, or orders. Entities are classified into:
Strong Entities (Independent, e.g., “Student”)
Weak Entities (Dependent on another entity, e.g., “Enrollment”)
Relationships define connections between entities. For instance, in a university database:
“Student” enrols in “Course” → Many-to-Many Relationship
Improved Data Integrity & Consistency – Defines clear relationships and constraints, ensuring accurate and reliable data management.
Foundation for Logical & Physical Design – ER diagrams provide the blueprint for further database development in SQL-based systems like MySQL, PostgreSQL, and Oracle.
Real-World Applications of ER Diagrams
ER diagrams are widely used in various industries:
E-commerce: Managing customers, orders, and payments (e.g., Amazon, Shopify)
Healthcare: Storing patient records, doctor assignments, and appointments
Banking: Tracking accounts, transactions, and loans
Example: In Amazon’s database, an ER diagram would map relationships between “Users,” “Orders,” and “Products,” ensuring smooth data flow.
Practical Tips for Students: How to Create an ER Diagram
Identify Entities – Define key objects in the system.
Determine Relationships – Establish connections between entities.
Add Attributes – Specify characteristics for each entity.
Define Cardinality – Decide on one-to-one, one-to-many, or many-to-many relationships.
Use ER Diagram Tools – Tools like Lucidchart, MySQL Workbench, or Microsoft Visio can help create professional ER diagrams.
Steps for Creating ER Diagrams
Creating an Entity-Relationship (ER) diagram involves several key steps to design a clear and structured database model. Below is a systematic approach to creating an effective ER diagram:
1. Identify Entities
Entities represent real-world objects or concepts that need to be stored in the database. List the main entities in the system. For example, in a bookstore database, entities could include Books, Customers, and Orders.
Entities can be categorized as:
Strong Entities: Entities that exist independently (e.g., Books, Customers).
Weak Entities: Entities that depend on a strong entity and lack a unique identifier (e.g., Order Items related to Orders).
2. Determine Relationships
Identify how entities interact with one another. Relationships define associations between entities. For instance, in a bookstore scenario:
A Customer places an Order
An Order contains multiple Books
Types of relationships include:
One-to-One (1:1): An entity instance is related to only one instance of another entity.
One-to-Many (1:M): An instance of one entity is associated with multiple instances of another.
Many-to-Many (M:N): Multiple instances of both entities relate to each other, typically requiring an associative entity (junction table).
3. Define Attributes
Each entity should have relevant attributes that describe its properties. For example:
Book: Title, Author, ISBN, Price
Customer: Name, Email, Phone Number
Order: Order ID, Date, Total Amount
Attributes can be further classified as:
Simple Attributes: Cannot be divided further (e.g., ISBN, Name).
Composite Attributes: Can be broken down into smaller parts (e.g., Full Name → First Name, Last Name).
Derived Attributes: Can be calculated from other attributes (e.g., Age derived from Date of Birth).
Multivalued Attributes: Can have multiple values for a single entity instance (e.g., a Book may have multiple authors).
4. Establish Cardinality and Participation Constraints
Cardinality defines the number of occurrences between two entities:
1:1 Relationship: A person has one passport, and a passport belongs to one person.
1:M Relationship: A customer can place multiple orders, but each order belongs to one customer.
M:N Relationship: A student can enroll in multiple courses, and a course can have multiple students.
Participation constraints determine whether an entity must participate in a relationship:
Total Participation: Every entity instance must be part of a relationship (e.g., every order must be placed by a customer).
Partial Participation: Some entity instances may not be involved (e.g., not all customers place orders).
5. Draw the Diagram
Use standard ER diagram notation:
Rectangles represent entities.
Diamonds represent relationships.
Ovals represent attributes.
Lines connect relationships to entities.
Below is a basic ER diagram for a bookstore database:
Generalization & Specialization: If an entity (e.g., Employee) has sub-entities (e.g., Manager, Developer).
Aggregation: When a relationship itself acts as an entity (e.g., Loan approval involving Customer, Bank, and Loan Officer).
6. Review and Refine
Examine your ER diagram for accuracy and completeness. Ensure proper representation of entities, attributes, and relationships. Refine the diagram to improve clarity and consistency.
7. Iterate as Needed
Database design is often an iterative process. Modify the ER diagram as new requirements emerge, ensuring a well-structured data representation.
Benefits of Using ER Diagrams
Using ER diagrams in database assignments offers numerous advantages:
1. Enhanced Communication
ER diagrams visually represent the database structure, making it easier for students and instructors to understand relationships between entities.
2. Efficient Database Design
Students can avoid design flaws such as data redundancy and inconsistency by defining entities, attributes, and relationships early.
3. Better Understanding of Relationships
Visualizing relationships between entities helps students grasp complex database structures, improving their ability to design normalized databases.
4. Simplified Database Modification
ER diagrams allow for easy modifications, as students can quickly identify where to make changes without disrupting the entire structure.
5. Improved Problem-Solving Skills
Creating ER diagrams requires critical thinking, which enhances students’ ability to analyze database requirements and translate them into an efficient structure.
6. Ensures Data Integrity and Consistency
By mapping out primary, foreign, and constraints, ER diagrams help maintain data integrity and prevent anomalies in database operations.
7. Facilitates System Documentation
An ER diagram serves as a blueprint for database development, making it easier for developers, analysts, and stakeholders to understand the system structure.
ER diagrams are widely used beyond academic assignments in various industries:
1. E-commerce
Managing customers, orders, inventory, and suppliers.
Tracking user interactions and purchase histories.
2. Healthcare
Organizing patient records, treatments, medical history, and doctor schedules.
Managing hospital assets, insurance claims, and pharmacy stock.
3. Banking & Finance
Structuring account management, transactions, customer profiles, and loans.
Ensuring secure data management and fraud detection.
4. Education
Managing students, courses, instructors, and enrollments.
Facilitating student performance tracking and automated grading systems.
5. Social Media
Structuring user profiles, posts, comments, and friend relationships.
Managing privacy settings and personalized content recommendations.
6. Logistics & Supply Chain
Mapping warehouse inventory, shipments, tracking, and delivery schedules.
Managing real-time stock updates and predictive analytics.
Understanding ER diagrams prepares students for real-world database development, bridging the gap between theory and practice.
Challenges in ER Diagram Assignments
While ER diagrams are helpful, students may face the following challenges:
1. Understanding Complex Relationships
Some assignments involve recursive relationships (an entity related to itself) or ternary relationships (relationships involving three entities).
Solution: Break down relationships into simpler components and use associative entities when necessary.
2. Correct Notation Usage
Errors in symbols and notation can lead to misinterpretation.
Solution: Familiarize yourself with standard ER diagram conventions used in database design.
3. Ensuring Data Integrity
Proper handling of primary keys, foreign keys, and constraints is critical for maintaining data integrity.
Solution: Clearly define relationships and enforce referential integrity.
4. Balancing Complexity and Simplicity
Overcomplicating an ER diagram can make it harder to interpret.
Solution: Focus on essential entities and relationships, avoiding unnecessary details.
Chen ER Diagram: Explained
Chen ER Diagram
The Chen ER diagram, also known as the Chen notation, is one of the earliest methods for modeling database relationships. It provides a conceptual view of data, emphasizing entities, attributes, and relationships.
Key Components of a Chen ER Diagram:
Entities: Represent objects or concepts, such as Customers, Orders, or Products. These are shown as rectangles.
Attributes: Define characteristics of entities, such as Name, Address, or Price. Attributes are depicted as ovals.
Relationships: Indicate how entities interact, such as “places” (Customer-Order) or “contains” (Order-Product). Relationships are represented as diamonds.
Cardinality: Specifies the number of instances of one entity related to another. For example, a Customer can place many Orders, but each Order belongs to only one Customer.
Keys: Identify unique instances of an entity. For example, Customer ID uniquely identifies each Customer.
Example: Chen ER Diagram
Imagine an e-commerce system where Customers place Orders:
Entities: Customer, Order, Product
Relationships: A Customer places Orders, an Order contains Products
Attributes: Customer (Name, Email), Order (Date, Total Price), Product (Name, Price)
Crow’s Foot ER Diagram
The Crow’s Foot notation is another ER diagram style that provides a clearer representation of relationships and cardinality. It is widely used in modern database design.
Key Differences from Chen Notation:
Entities: Represented as rectangles.
Attributes: These are typically listed inside the entity rather than shown as separate ovals.
Relationships: Depicted with lines instead of diamonds.
Cardinality: Expressed using symbols at the end of relationship lines:
| (One)
O (Zero)
< (Many) – Resembling a crow’s foot
Example: Crow’s Foot ER Diagram
A University Database where Students enroll in Courses:
Entities: Student, Course
Relationships: A Student can enroll in many Courses, and a Course can have many Students
Cardinality: One-to-Many (1:M) or Many-to-Many (M:M)
Entity Relationship Diagram (ERD): A General Overview
An ERD is a standardized way to model databases using different notations, including Chen and Crow’s Foot.
Essential Components of an ERD:
Entity: A real-world object (e.g., Employee, Department)
Attribute: A characteristic of an entity (e.g., Employee Name, Salary)
Relationship: How entities interact (e.g., “Employee works in Department”)
Cardinality: Defines how many instances of one entity relate to another
Primary Key: A unique identifier for each entity (e.g., Employee ID)
ER Diagram Symbols & Cardinality Notation
Cardinality defines the numerical relationship between entities. Common symbols include:
(1): One-to-One (e.g., A Person has one Passport)
(0 or 1): Optional One-to-One (e.g., A Car may have zero or one Parking Space)
(0 or ∞): Optional Many (e.g., A Customer can place zero or many Orders)
(1 or ∞): Mandatory Many (e.g., A Student must enroll in at least one Course)
These symbols help enforce data integrity and define business rules in databases.
Tools for Creating ER Diagrams
Several tools can help design ER diagrams efficiently:
Lucidchart – Cloud-based, easy-to-use ER diagram software.
Microsoft Visio – Advanced diagramming tool with database modeling features.
Draw.io – Free, web-based tool for creating ER diagrams.
MySQL Workbench – Database design tool with reverse engineering capabilities.
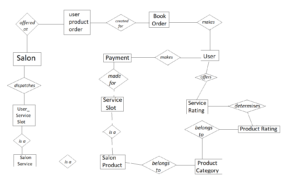
A salon management database is a system designed to efficiently organize and manage the operations of a salon or spa. It stores and manages a wide range of information related to various aspects of salon management, including client data, staff information, appointment scheduling, inventory management, sales and billing, and reporting.
The database typically consists of multiple interconnected tables that store specific types of information. Here are some key components of a salon management database:
Client Management: The database stores client details such as names, contact information, appointment history, services availed, and preferences. It allows salon staff to quickly access client information, manage appointments, track client preferences, and provide personalized services.
Staff Information: The database maintains a record of staff members, including stylists, estheticians, and therapists. It includes details such as names, contact information, roles, work schedules, performance records, and training history. This information helps in staff management, scheduling, and payroll processing.
Appointment Scheduling: The database enables salon staff to schedule and manage appointments efficiently. It tracks available time slots, client preferences, staff availability, and service requirements. It may also include features for automated reminders and notifications to clients and staff.
Inventory Management: The database tracks salon inventory, including products, supplies, and equipment. It helps monitor stock levels, reorder items, and manage supplier information, ensuring that the salon always has the necessary supplies on hand.
Sales and Billing: The database records sales transactions, including services rendered, products sold, pricing, discounts, and payment details. It generates invoices, tracks payment status, and maintains a financial record of transactions. It may also integrate with payment systems for seamless and secure payment processing.
Reporting and Analytics: The database generates reports and analytics on various aspects of salon operations. These may include sales reports, appointment statistics, client demographics, staff performance, and inventory analysis. These insights help in making informed business decisions and optimizing salon performance.
Example 1 : Relational Schema ERD
Example 2
Example 3
How to create er diagram in draw.io
Step-by-Step Guide to Creating an ER Diagram in draw.io (diagrams.net). Creating an Entity-Relationship Diagram (ERD) in draw.io (now known as diagrams.net) is straightforward. This guide will walk you through everything from setting up your workspace to exporting your finished ERD.
MySQL Workbench is a powerful tool for designing and visualizing database structures through Entity-Relationship Diagrams (ERDs). These diagrams help in defining relationships between database tables, making it easier to structure a database efficiently.
This guide will take you through creating an ERD from scratch, reverse engineering an existing database, and exporting your diagram.
Part 1: Creating an ER Diagram from Scratch
Step 1: Open MySQL Workbench
Launch MySQL Workbench on your computer.
Click on “File” → “New Model” to create a new database model.
A new window called MySQL Model will open.
Click the “Add Diagram” button (a blue icon with a + symbol) to start designing your EER (Enhanced Entity-Relationship) diagram.
A blank EER Diagram canvas will appear.
Step 2: Add Entities (Tables)
Entities represent database tables. You need to define them before adding relationships.
In the toolbox (left panel), click on “Place a New Table” (the table icon).
Click anywhere on the canvas to add a table.
Double-click on the table to open the Table Editor.
Rename the table (e.g., Student, Course).
Define the table columns (attributes) in the Columns tab.
Step 3: Define Attributes (Columns)
Each table needs a set of columns (fields) with appropriate data types.
Inside the Table Editor, go to the Columns tab.
Add column names (e.g., Student_ID, Name, Email).
Assign data types (e.g., INT, VARCHAR(255), DATE).
Mark the Primary Key (PK) by checking the PK box next to the primary column (Student_ID).
If a column references another table (i.e., it is a Foreign Key (FK)), it will be assigned in the next step.
Best Practices for Attributes:
Use INT for Primary Keys (IDs).
Use VARCHAR(255) for text fields like names and emails.
Use DATE for date-related fields.
Step 4: Create Relationships (Foreign Keys)
Relationships show how tables are connected. In MySQL Workbench, you can use different relationship types:
1. One-to-Many (1:M) Relationship
For example, a Studentenrolls in multiple Courses.
Click “1:n (Place a New Foreign Key)” in the toolbox.
Click the child table (e.g., Enrollment) first.
Then click the parent table (e.g., Student) to establish the one-to-many relationship.
MySQL Workbench automatically creates a Foreign Key (FK) in the child table.
2. One-to-One (1:1) Relationship
For example, each Student has oneStudent_Profile.
Click “1:1” (Place a One-to-One Relationship) in the toolbox.
Click on both tables to create a one-to-one relationship.
3. Many-to-Many (M:N) Relationship
For example, Studentsenroll in multiple Courses, and each Course has multiple Students.
Create a junction table (Enrollment) manually.
Define two One-to-Many (1:M) relationships:
Student (1) → Enrollment (M)
Course (1) → Enrollment (M)
The Enrollment table will store foreign keys (Student_ID, Course_ID) linking Student and Course.
Foreign Key Notation:
FK_Student_ID → References Student(Student_ID)
FK_Course_ID → References Course(Course_ID)
Step 5: Customize the Diagram
Move entities to organize the diagram neatly.
Adjust line connections to avoid overlapping.
Change notation style:
Click “Model” → “Relationship Notation”.
Choose “Crow’s Foot” (most commonly used).
Use colors: Right-click an entity → “Edit Table” → Change colors for better visualization.
Step 6: Save and Export the ERD
Save the Model
Click “File” → “Save Model As”
Choose a location and save the model (.mwb file).
Export as an Image or PDF
Click “File” → “Export” → “Export as PNG/PDF”.
Select a destination folder.
Click “Save”.
Generate SQL Script
Click “Database” → “Forward Engineer”
MySQL Workbench will generate the SQL schema based on your ERD.
Part 2: Creating an ERD from an Existing Database (Reverse Engineering)
If you already have a database and want to generate an ERD, use reverse engineering.
Step 1: Connect to MySQL Server
Open MySQL Workbench.
Click “Database” → “Connect to Database”.
Enter your hostname, username, and password.
Click “OK” to connect.
Step 2: Reverse Engineer the Database
Click “Database” → “Reverse Engineer”.
Select your database connection and click “Next”.
Choose the schema (database) to import and click “Next”.
MySQL Workbench will scan the database and generate an ERD automatically.
This method is proper when working with existing databases to visualize relationships.
Example ER Diagram: Student-Course Enrollment System
An Entity-Relationship Diagram (ERD) is essential for designing and visualizing database structures. Lucidchart’s intuitive interface and pre-built shape libraries make it easy to create professional ER diagrams. Follow this step-by-step guide to create your ER diagram in Lucidchart.
Step 1: Sign In & Create a New Document
Before you begin, you need to sign in to Lucidchart and create a new workspace.
If you already have an account, click Sign In and enter your credentials.
If you’re a new user, sign up for a free account.
Create a New Document
Click the + New Document button.
Choose Blank Document to start from scratch.
Step 2: Enable the ERD Shape Library
Lucidchart provides a dedicated Entity-Relationship (ERD) shape library that includes entity shapes, relationships, and database symbols.
Open the Shapes Panel
On the left toolbar, click + Shapes.
Enable the ERD Shape Library
Scroll down and find Entity-Relationship.
Check the box next to it and click Use Selected Shapes.
This will load all the necessary symbols required to design your ER diagram.
Step 3: Add Entities (Tables) to Your Diagram
Entities represent database tables and contain attributes (columns).
Drag an Entity Shape onto the Canvas
From the ERD shape library, drag a rectangle (Entity shape) onto the workspace.
Rename the Entity
Double-click inside the rectangle and type the name of your entity (e.g., Student, Course, Enrollment).
Add Attributes (Columns)
Click inside the entity and list its attributes (e.g., StudentID, Name, Email, DOB).
Example: Student Table
Attribute
Description
PK_StudentID
Primary Key (Unique ID for students)
Name
Student’s full name
Email
Contact email
DOB
Date of birth
Repeat this process for all tables in your database.
Step 4: Define Relationships Between Entities
Once you have entities, you need to define how they relate to each other.
Use Connectors to Link Entities
Select the line tool from the toolbar.
Connect entities by dragging lines between them.
Set Relationship Cardinality
Click on the connector line to edit relationship types:
One-to-One (1:1)
One-to-Many (1:M)
Many-to-Many (M:N)
Label the Relationships
Click on the relationship line and type a label (e.g., “Enrolled in” between Student and Course).
Example Relationship:
One Student can enroll in multiple Courses (1:M).
One Course can have multiple Students (M:1).
To handle this many-to-many relationship, introduce a junction table called Enrollment.
Step 5: Add Primary and Foreign Keys
To enforce referential integrity, you must define Primary Keys (PKs) and Foreign Keys (FKs).
Assign a Primary Key (PK)
In each entity, designate a unique identifier (e.g., StudentID in Student Table).
Prefix it with “PK_” (e.g., PK_StudentID).
Add Foreign Keys (FK)
A Foreign Key (FK) links one table to another.
Prefix it with “FK_” (e.g., FK_CourseID in Enrollment Table).
Example: Enrollment Table
Attribute
Description
PK_EnrollmentID
Unique ID for each enrollment
FK_StudentID
Links to Student Table
FK_CourseID
Links to Course Table
EnrollmentDate
Date of enrollment
Step 6: Customize & Format Your ER Diagram
Once your ERD is complete, you can enhance readability with formatting options.
Use Colors & Styles
Click on an entity to change its color, font size, or border style.
Differentiate entity types with color coding (e.g., Students in blue, Courses in green).
Adjust Layout
Drag and position entities for better readability.
Use alignment guides to organize elements neatly.
Step 7: Save, Export, or Share Your ER Diagram
Lucidchart allows you to download, share, or collaborate on your ER diagram.
Save Your Work
Click File > Save to store your diagram.
Export as an Image/PDF
Click File > Download As and choose PNG, JPG, PDF, or SVG.
Share with Others
Click Share to invite teammates via email.
Adjust permissions for view-only or editing access.
How to create er diagram in Visio
Microsoft Visio is a powerful tool for creating Entity-Relationship Diagrams (ERDs). It helps you visually design database structures with tables, attributes, and relationships. This guide provides step-by-step instructions for creating an ERD in Visio Professional.
What You Need
Microsoft Visio Professional (Standard versions don’t support database modeling) Basic knowledge of database concepts (Tables, Primary Keys, Foreign Keys, Relationships)
Part 1: Setting Up Visio for ERD Creation
Step 1: Open Microsoft Visio
Launch Microsoft Visio on your computer.
Click “File” → “New”.
In the search bar, type “Database Model Diagram”.
Select “Database Model Diagram” and click “Create”.
If you don’t see this template, make sure you’re using Visio Professional or Visio Plan 2.
Step 2: Enable the Database Modeling Features
Go to the “Database” tab in the Visio ribbon.
If the “Database” tab is missing:
Click “File” → “Options” → “Customize Ribbon”.
Under “Main Tabs,” check “Database Modeling” and click “OK”.
Now you’re ready to build your ERD.
Part 2: Creating the ER Diagram
Step 3: Add Entities (Tables)
Entities represent database tables. You need to define them before adding relationships.
In the Shapes pane (left side), find the “Entity” shape.
Drag and drop an Entity onto the canvas.
Double-click the entity to open the “Database Properties” window.
Under the “Definition” tab, rename the entity (e.g., Student, Course).
Step 4: Define Attributes (Columns)
Each table needs columns (fields) with appropriate data types.
Select the Entity and open the “Database Properties” window.
Click the “Columns” section.
Add column names and assign data types:
Example: Student_ID (INT), Name (VARCHAR), Email (VARCHAR)
Mark the Primary Key (PK) by checking the “Primary Key” box.
If a column references another table (Foreign Key – FK), define relationships in the next step.
Best Practices:
Use INT for Primary Keys.
Use VARCHAR(255) for text fields.
Use DATE for date fields.
Step 5: Create Relationships (Foreign Keys)
Relationships show how tables are connected. You can define One-to-Many (1:M), One-to-One (1:1), or Many-to-Many (M:N) relationships.
1. One-to-Many (1:M) Relationship
For example, a Student can enroll in manyCourses, but each Course can have manyStudents.
In the Shapes pane, find the “Relationship” shape.
Drag and drop a Relationship onto the canvas.
Connect:
One end to the Primary Key (PK) in the parent table (Student).
The other end to the Foreign Key (FK) in the child table (Enrollment).
Visio automatically adds a Foreign Key (FK) to the child table.
Example:
Student (1) → Enrollment (M)
Course (1) → Enrollment (M)
2. One-to-One (1:1) Relationship
For example, each Student has oneStudent_Profile.
Drag the “One-to-One” Relationship shape.
Connect both tables to define a 1:1 relationship.
3. Many-to-Many (M:N) Relationship
For example, Studentsenroll in multiple Courses, and each Course has multiple Students.
Create a junction table (Enrollment).
Define two One-to-Many (1:M) relationships:
Student (1) → Enrollment (M)
Course (1) → Enrollment (M)
The Enrollment table will store Student_ID and Course_ID as Foreign Keys (FKs).
Step 6: Customize the Diagram
Move tables to improve readability.
Resize entities for clarity.
Format relationships (Right-click → “Format Shape”).
Enable Crow’s Foot Notation:
Click “Database” → “Display Options”.
Under “Relationships”, select “Crow’s Foot” notation.
Part 3: Saving & Exporting the ERD
Step 7: Save the Visio Diagram
Click “File” → “Save As”.
Choose .vsdx (default Visio format).
Step 8: Export as an Image/PDF
Click “File” → “Export” → “Export As”.
Choose PNG/PDF format.
Save the diagram.
Example ER Diagram: Student-Course Enrollment System
Creating an Entity-Relationship (ER) diagram is a crucial step in database design, helping to visualize how data is structured and interrelated. Whether you’re a beginner or an experienced student, mastering ER diagrams can significantly improve your database modeling skills. Here are some expert tips to help you complete ER diagram assignments effectively.
1. Understand the Requirements
Before starting, carefully read your assignment instructions to determine the scope of your ER diagram. Identify:
Entities (e.g., Student, Course, Library)
Relationships (e.g., A Student enrolls in a Course)
Attributes (e.g., Student_ID, Course_Name)
Constraints (e.g., One student can enroll in multiple courses)
Pro Tip: Highlight key requirements in your assignment prompt to ensure you include all necessary elements in your diagram.
2. Break It Down Step by Step
To avoid confusion, tackle your ER diagram in stages:
Identify Entities: List all real-world objects that store data (e.g., Customers, Orders).
Define Relationships: Determine how entities are linked (e.g., A Customer places an Order).
Specify Attributes: Include primary keys (unique identifiers) and descriptive attributes.
Refine & Validate: Ensure your diagram follows normalization rules to eliminate redundancy.
3. Use Visual Aids for Clarity
A well-structured ER diagram should be easy to read. Improve readability with:
Consistent shapes (Rectangles for entities, diamonds for relationships, ovals for attributes)
Color coding (Different colors for entities, relationships, and weak entities)
Proper notation (Crow’s foot, UML, or Chen notation to show relationships clearly)
Example: If designing an ER diagram for a Library Management System, you could use:
Entity: Book (Book_ID, Title, Author, Genre)
Entity: Member (Member_ID, Name, Contact)
Relationship: “Borrows” (One Member can borrow many Books, but only one Member borrows a Book at a time)
4. Avoid Common Mistakes
Students often make errors that can impact their assignments. Be sure to: Avoid redundant entities or duplicate relationships. Ensure primary and foreign keys are correctly assigned. Check that relationships accurately represent real-world interactions.
5. Use ER Diagram Tools
Instead of drawing diagrams manually, use specialized tools to create professional-looking ER diagrams:
Before submitting your assignment, review it against these questions:
Does every entity have a unique identifier (primary key)?
Are all relationships adequately labelled and correctly linked?
Have you followed the required notation style (Chen, Crow’s Foot, UML)?
Does your diagram align with the given assignment prompt?
Best Practices for ER Diagrams
Use clear, meaningful names for entities and attributes.
Avoid redundancy by normalizing data.
Use proper cardinality to maintain data integrity.
Make diagrams readable by keeping them structured and uncluttered.


 Evan John
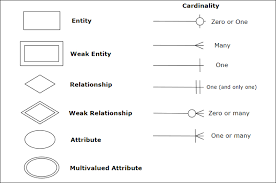


 Best Practices:
 Pro Tip: Highlight key requirements in your assignment prompt to ensure you include all necessary elements in your diagram.