Writing the result section of a research paper is a critical aspect of communicating the findings of a study to the academic community. This section serves as the platform for presenting data analysis outcomes, validating hypotheses or research questions, and drawing meaningful conclusions based on empirical evidence.
Writing a well-structured and informative result section requires careful planning, attention to detail, and adherence to established guidelines. We will explore the key considerations and best practices for writing a results section that effectively communicates your research findings, contributes to advancing knowledge in your field, and enhances the overall impact of your paper.
Results Section Structure
The structure of the results section in a research paper typically follows a standard format to effectively communicate the study’s findings. Check the standard structure for organizing the results section
- Introduction to the Results
- Briefly introduce the purpose of the study and remind readers of the research questions or hypotheses being addressed.
- Provide an overview of the data analysis methods used to analyze the data.
- Descriptive Statistics (for quantitative studies):
- Present basic descriptive statistics such as means, standard deviations, frequencies, and percentages relevant to the investigated variables.
- Use tables and charts to summarize the main characteristics of the data.
- Main Findings:
- Present the main results of the study in a logical order, following the sequence of research questions or hypotheses.
- For each research question or hypothesis, provide a clear and concise summary of the findings.
- Include relevant statistical tests, effect sizes, and significance levels to support the findings.
- Use subheadings to organize the presentation of results if the study involves multiple analyses or distinct research questions.
- Supporting Details:
- Provide additional details and analyses to support the main findings, if necessary.
- Include any relevant subgroup analyses, exploratory analyses, or sensitivity analyses conducted.
- Present findings from any additional measures or variables that were explored but were not the primary focus of the study.
- Comparison with Previous Research:
- Discuss how the current study’s results compare with previous research findings.
- Highlight similarities, differences, or unexpected findings and provide possible explanations or interpretations.
- Use citations to support your comparisons and interpretations.
- Limitations:
- Acknowledge any limitations or constraints of the study that may have affected the results.
- Discuss potential sources of bias, methodological limitations, or constraints on generalizability.
- Be transparent about any challenges or shortcomings encountered during data collection, analysis, or interpretation.
- Implications:
- Discuss the implications of the findings for theory, practice, policy, or future research.
- Highlight the significance of the results and their potential contributions to the field.
- Consider the practical implications of the findings and how they may be applied in real-world settings.
- Conclusion:
- Summarize the main findings of the study and reiterate their importance.
- Emphasize the key contributions of the study and its implications for advancing knowledge in the field.
- Avoid introducing new information or making speculative claims not supported by the data.
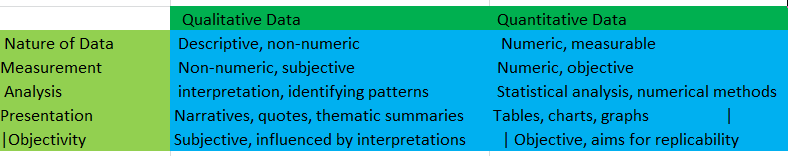
Differences Between Qualitative and Quantitative Data
Qualitative and quantitative data are the two main types used in research and analysis, each with its characteristics and collection methods. Here’s a breakdown of their key differences:
- Nature of Data:
- Qualitative Data: This type of data is descriptive and deals with qualities or characteristics that cannot be measured numerically. It focuses on understanding individuals’ underlying reasons, motivations, opinions, and behaviours. Examples include interviews, open-ended survey responses, observations, and textual analysis.
- Quantitative Data: Quantitative data, on the other hand, deals with quantities and numerical values that can be measured and analyzed statistically. It is structured and often involves counting or measuring attributes. Examples include surveys with closed-ended questions, measurements, counts, and statistical analysis of numerical data.
- Measurement:
- Qualitative Data: Measurements in qualitative data are non-numeric and often subjective. They rely on researchers’ or participants’ interpretations, classifications, and categorizations. This data is typically expressed through words, images, or symbols.
- Quantitative Data: Quantitative data involves numerical measurements and objective observations that can be counted or measured. It provides precise and standardized information for statistical analysis and mathematical computations.
- Analysis:
- Qualitative Data: Qualitative data analysis involves identifying patterns, themes, and trends through interpretation. It requires a deep understanding of context and often involves coding, categorizing, and interpreting textual or visual data.
- Quantitative Data: Quantitative data analysis is focused on statistical techniques such as mean, median, mode, standard deviation, correlation, regression, and hypothesis testing. It aims to quantify relationships, patterns, and trends in data through numerical analysis.
- Presentation:
- Qualitative Data: Qualitative data is often presented through narratives, quotes, case studies, or thematic summaries. Visual representations such as charts or graphs may also illustrate findings.
- Quantitative Data: Quantitative data is typically presented through tables, charts, graphs, or statistical summaries, visually representing numerical information. These visualizations help to communicate trends, comparisons, and relationships in the data.
- Objectivity:
- Qualitative Data: Qualitative data collection and analysis are subjective processes influenced by the perspectives and interpretations of researchers or participants. It allows for a deeper exploration of complex phenomena but may be prone to bias.
- Quantitative Data: Quantitative data collection and analysis aim for objectivity and replicability. It relies on standardized procedures and statistical methods to minimize bias and ensure reliability and validity.
Purpose of a Results Section
The purpose of the results section in a research paper is to present and describe the study’s findings in a clear, organized, and unbiased manner. This section serves several important purposes:
- Communication of Findings: The results section provides a platform for researchers to report the outcomes of their study, including any significant findings, patterns, trends, or relationships observed in the data.
- Verification of Hypotheses or Research Questions: It allows researchers to assess whether the data supports their hypotheses or research questions. By presenting the results, researchers can demonstrate how the collected data aligns with or diverges from their initial expectations.
- Transparency and Replicability: The results section promotes transparency by allowing readers to assess the credibility and validity of the study’s findings. By providing detailed descriptions of the data analysis methods and presenting the results clearly, researchers enable others to replicate their work and verify the robustness of the findings.
- Evidence-Based Conclusions: The findings presented in the results section serve as the basis for drawing conclusions and interpreting the research topic. Researchers can use the results to support their arguments, theories, or claims and to generate new insights or hypotheses for future investigation.
- Contribution to Knowledge: By disseminating the results of their research, authors contribute to the collective body of knowledge in their field. The results section allows researchers to share discoveries, advancements, or insights with the academic community and to build upon existing knowledge.
- Guidance for Decision-Making: Depending on the nature of the study, the results section may offer practical guidance or recommendations for decision-makers, practitioners, policymakers, or other stakeholders. The findings may inform strategies, interventions, policies, or practices to address real-world challenges or issues.
How to write the result section of a research paper
- Organize the Results Logically: Begin by summarizing the main findings of your study, highlighting the key points that will be discussed in the results section. Then, present the results in a logical sequence that follows the structure of your research questions or hypotheses. Start with the most critical findings and progress to the supporting details. This logical organization helps readers follow the flow of your argument and understand the significance of each result in context.
- Be Concise and Specific: When reporting your results, aim for clarity and precision. Focus on presenting the most relevant and significant findings while avoiding unnecessary detail. Use clear and straightforward language to describe your results, and provide specific numerical values, percentages, or other quantitative measures to support your claims. Explain any abbreviations or technical terms to ensure your results are accessible to a broad audience.
- Use Headings and Subheadings: Break up your results section into distinct sections using descriptive headings and subheadings. This helps readers navigate through the text and locate specific information more easily. Each heading should indicate the focus of the section and provide a brief overview of the results that will be discussed. Use consistent formatting and hierarchy for your headings to maintain clarity and organization.
- Present Data Clearly: Visual aids such as tables, charts, graphs, and diagrams can help to clarify and illustrate your findings. Choose the most appropriate format for presenting your data based on the type of information you need to convey. Ensure that all visual elements are properly labeled and explained in the text to help readers interpret the data accurately. Use captions and annotations to provide context and highlight key insights or trends.
- Provide Context: Before delving into the specific results, summarize the methods used to collect and analyze the data. This background information helps readers understand how the results were obtained and evaluated. Describe the sample population, data collection procedures, and any relevant variables or measures used in the study. This context setting ensures readers have the necessary information to interpret the results accurately.
- Report Statistical Analyses: If your study involved statistical analysis, clearly report the results of these analyses in the results section. Describe the statistical tests, methods, and any relevant parameters or assumptions. Present the numerical values, significance levels, confidence intervals, and effect sizes for each analysis to provide a comprehensive overview of the findings. Be transparent about the statistical methods used and avoid oversimplifying or misrepresenting the results.
- Focus on Interpretation: After presenting the results, provide an interpretation of their meaning and significance about the research questions or hypotheses of the study. Discuss the implications of the findings and consider alternative explanations or interpretations. Highlight any unexpected or counterintuitive results and explore possible reasons for these outcomes. Engage critically with the data and offer insights contributing to a deeper understanding of the research topic.
- Be Objective and Neutral: Maintain objectivity and neutrality when presenting and interpreting your results. Avoid inserting personal opinions or biases into your analysis, and focus on delivering the facts objectively. Stick to the data and avoid making exaggerated claims or conclusions not supported by the evidence. Remember that the results speak for themselves, and it is your job as the researcher to report and interpret them without bias accurately.
- Acknowledge Limitations: Every study has limitations, and it’s essential to acknowledge these in the results section. Discuss any potential sources of bias, error, or uncertainty that may have influenced the results. Be honest and transparent about the limitations of your study, and consider their implications for the interpretation and generalizability of your findings. This demonstrates intellectual honesty and helps readers evaluate the validity and reliability of your results.
- Avoid Repetition: While providing sufficient detail to support your findings is important, avoid repeating information already presented in the methods or materials sections. Focus on presenting new insights and interpreting their significance about the study objectives. Be concise and to the point, focusing on the most salient aspects of your results while avoiding unnecessary repetition or redundancy.
Example of result section in research paper
Example 1
The Effect of Peer Tutoring on High School Students’ Academic Performance in Mathematics.”
4. Results
4.1 Overview of Participants
The final sample included 100 high school students randomly assigned into two groups:
The average age across the sample was 16.3 years (SD = 0.9), with a relatively balanced gender distribution (52% female, 48% male). Demographic characteristics such as socioeconomic status and prior academic achievement were comparable between the two groups.
These similarities suggest that random assignment was successful, and any differences observed post-intervention are more likely due to the treatment itself.
4.2 Baseline Mathematics Performance
Before the intervention, all participants completed a standardized math pre-test to assess their initial academic standing. Results showed no significant differences between the two groups:
-
Peer Tutoring Group: M = 64.2, SD = 8.1
-
Control Group: M = 63.8, SD = 7.9
-
t(98) = 0.24, p = .812
These findings confirm that both groups started at a similar academic level, allowing for a fair comparison of post-intervention outcomes.
4.3 Post-Intervention Mathematics Performance
After a four-week peer tutoring program, students in the intervention group demonstrated significantly greater improvement in mathematics scores compared to the control group.
-
Peer Tutoring Group: M = 78.5, SD = 7.4
-
Control Group: M = 68.9, SD = 8.2
-
t(98) = 6.45, p < .001, Cohen’s d = 0.91
This large effect size indicates that peer tutoring had a substantial positive impact on students’ academic performance in mathematics. Figure 1 visually depicts the differences between the groups.
Figure 1: Post-Test Scores by Group
The chart illustrates a higher average score and tighter distribution among peer-tutored students.
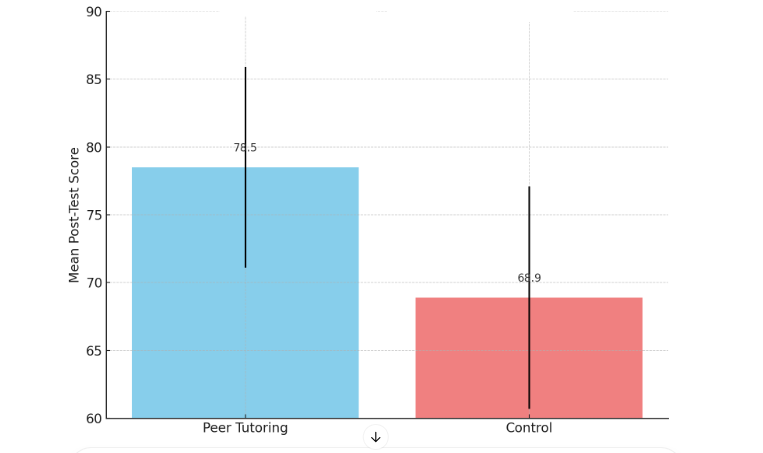
Figure 1 visually depicts the difference in post-test mathematics scores between the Peer Tutoring and Control groups. The chart shows that the peer-tutored students not only achieved higher average scores but also exhibited slightly less variability in performance.
4.4 Performance Improvement Within Groups
To assess progress within each group, paired sample t-tests were conducted:
-
Peer Tutoring Group:
Pre-test M = 64.2 → Post-test M = 78.5
t(49) = 12.62, p < .001
-
Control Group:
Pre-test M = 63.8 → Post-test M = 68.9
t(49) = 4.10, p < .001
Both groups showed statistically significant improvement, but the peer tutoring group improved magnitude and statistical strength more.
4.5 Gender Differences and Interactions
A two-way ANOVA explored the interaction between group (peer tutoring vs. control) and gender (male vs. female). Results indicated:
-
No significant main effect for gender: F(1, 96) = 0.78, p = .379
-
No significant interaction effect: F(1, 96) = 1.21, p = .274
This suggests that peer tutoring was equally effective across genders, and gender did not influence the impact of the intervention.
4.6 Qualitative Feedback from Students
In addition to quantitative data, students in the peer tutoring group provided open-ended responses about their experiences. Several recurring themes were identified:
-
Increased confidence in problem-solving
-
Improved communication skills through teaching others
-
Stronger understanding of mathematical concepts
 “Explaining problems to my peer helped me understand them better myself.” – Student A
“I used to get stuck easily, but talking it out with a partner helped me a lot.” – Student B
These responses offer contextual insights into the mechanisms behind the observed improvements.
4.7 Summary of Key Findings
-
Peer tutoring led to significantly higher gains in math scores than traditional classroom instruction.
-
The effect was consistent across gender groups.
-
Student feedback supports the cognitive and motivational benefits of peer-assisted learning.
4.8 Limitations of Results
While results are promising, a few limitations must be acknowledged:
-
The study was conducted in one school, limiting generalizability.
-
The intervention lasted only four weeks; longer-term effects are unknown.
-
Self-reported feedback may be subject to bias.
These limitations are further addressed in the Discussion section, but they are noted here to maintain transparency and avoid overstating the findings.
Example 2
4. Examples of Results Section
Let’s now look at some original examples of how to write the results section across different scenarios. Each example focuses on a unique element, from data preparation to statistical reporting, to help you better understand how to present your findings effectively and clearly.
4.1. An example of a preprocessing passage in the results section
Preprocessing is a critical step in many types of research, especially in fields that involve large datasets. In the example below from a machine learning study, the authors detail how they prepared their data before running predictive models. Notice how they lay out each step clearly and without interpretation.
Before analysis, the dataset was checked for missing values, and approximately 4% of entries were incomplete. These missing values were imputed using k-nearest neighbors (k=5) based on similarity across relevant variables. The data were then log-transformed to reduce skewness and standardized using z-scores. Finally, a moving average filter (window size = 3) was applied to smooth out short-term fluctuations.
Data cleaning _ Missing data treatment _ Normalization _ Smoothing
This example shows a transparent and logical progression of data handling steps. The authors make it easy for readers to replicate or understand the process.
4.2. An example of a main findings passage in the results section
When writing the main findings, it’s essential to be balanced—report what you found, what you didn’t find, and any surprises. Below is an example from an education study examining the impact of online learning on student performance.
Students in the blended learning group scored significantly higher on the final assessment than those in the fully online group (M = 82.4, SD = 5.1 vs. M = 76.9, SD = 6.3; p < 0.01). No significant differences were observed between the groups in terms of class participation (p = 0.27). Unexpectedly, students in the fully online group reported lower stress levels than their blended-learning counterparts (p < 0.05).
What was found? _ What was not found? _ Unexpected results
This paragraph objectively explains the study’s significant findings without interpretation or emotional language.
4.3. An example of using statistics in the results section
Statistical details make your findings more trustworthy and allow others to assess the rigour of your work. Below is an example from a psychology study on sleep and screen time.
Participants who used screens for more than 3 hours before bedtime reported significantly shorter sleep duration (mean = 5.9 ± 1.3 hours) compared to those who used screens less than 1 hour (mean = 7.2 ± 1.1 hours; p < 0.001). A linear regression showed screen time was a significant negative predictor of sleep quality (β = -0.42, t = -4.76, p < 0.001).
Descriptive statistics _ Inferential statistics _ Regression analysis
Using both descriptive (means and SDs) and inferential statistics (p-values, beta coefficients) strengthens the credibility of the findings.
4.4. An example of using figures and tables in the results section
Figures and tables are valuable tools for conveying complex data. Here’s how a climate science paper uses them effectively.
Table 3. Monthly Rainfall Data by Location (in mm)
Table 3. Detailed rainfall data for three locations shows consistent increases across all sites. The average values were used to plot the trend shown in Figure 2.
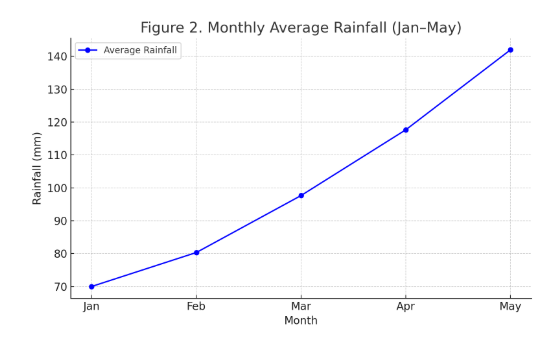
As shown in Figure 2, monthly rainfall amounts increased steadily from January to May, peaking at 142 mm. The sharpest rise was observed between March and April. The complete set of rainfall data for all locations and months is presented in Table 3.
This example strikes a good balance: trends are described in the text, visuals are used for clarity, and detailed data are available in a table.
Check on 200+ Quantitative Research Topics & Ideas 2024-2025
4.5. An example of elaborating trends or patterns in the results section
Identifying patterns can be especially important in experimental or observational research. Below is a chemistry-based example examining a reaction rate over time.
The reaction rate increased gradually as the temperature rose, reaching a peak at 70°C. Beyond this point, the rate declined sharply. A clear bell-shaped curve was observed in all three experimental replicates, indicating a consistent temperature-dependent pattern.
Trend identification _ Pattern consistency _ Evidence-based statement
This kind of observation helps the reader understand how one variable influences another without stepping into interpretation.
4.6. An example of subgroup analysis in the results section
Subgroup analysis can help highlight nuanced effects across different populations. Below is an example from a health intervention study.
While the overall program led to a reduction in BMI across participants (mean change = -1.8, p < 0.01), subgroup analysis revealed more substantial effects among female participants (mean change = -2.3) than males (mean change = -1.1). Age was also a factor: participants over 50 experienced smaller improvements than younger participants (p = 0.04).
Group-specific results _ Comparison by sex and age _ Statistically supported insight
Subgroup analyses like this add depth to your findings and show a thorough understanding of potential influencing factors.
Result Section Dos and Don’ts
DOs
-
Present Results Clearly and Objectively
-
Use tables, charts, and figures to make data easier to understand.
-
Focus on what the data shows, not what it means (save interpretation for the Discussion section).
-
Report All Relevant Findings
-
Include both significant and non-significant results.
-
Stay honest, and don’t leave out unexpected or contradictory results.
-
Use Subheadings for Organization
-
Be Concise but Thorough
-
Use Appropriate Statistical Language
-
Report p-values, confidence intervals, and effect sizes where relevant.
-
Be precise (e.g., “statistically significant at p < 0.05”).
-
Refer to Tables and Figures Properly
DON’Ts
-
Don’t Interpret the Results
-
Don’t Include Raw Data
-
Don’t Overload with Numbers
-
Don’t Use Vague Language
-
Don’t Skip Non-significant Findings
-
Don’t Repeat the Same Data in Multiple Forms
Conclusion
Writing a result section is essential for researchers seeking to disseminate their findings effectively and contribute meaningfully to their academic disciplines. By following the tips and guidelines outlined in this guide, researchers can craft results sections that are clear, concise, and compelling.
From organizing the presentation of data to providing context, interpreting findings, and acknowledging limitations, each aspect of the results section plays a crucial role in shaping the narrative of the research paper. With careful attention to detail and a commitment to transparency and objectivity, researchers can ensure that their results sections are informative, credible, and impactful, enhancing the overall quality and significance of their research contributions.


 Evan John